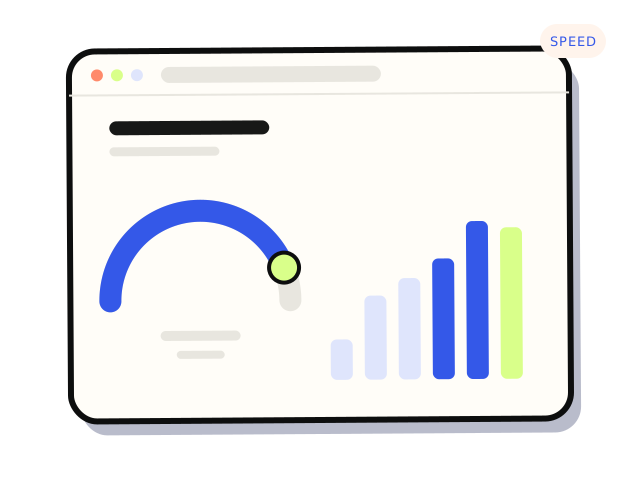
Core Web Vitals are Google’s three measures of page experience. Largest Contentful Paint (LCP) measures loading: how long until the main content appears. Interaction to Next Paint (INP) measures responsiveness: how quickly the page reacts when someone taps or clicks. Cumulative Layout Shift (CLS) measures visual stability: how much the layout moves while it loads. Google’s “good” thresholds are LCP of 2.5 seconds or less, INP of 200 milliseconds or less, and CLS of 0.1 or less, measured on real visits.
That’s the whole idea. The rest of this article is about reading the numbers sensibly, finding your own, and knowing which fixes are worth paying for.
What does each Core Web Vital measure?
LCP: does the page show up quickly? LCP is the time from when someone starts loading the page to when the largest visible element, usually a hero image, a banner or a big block of heading text, has rendered. Over 2.5 seconds is “needs improvement”, and over 4 seconds is “poor”. On most small business sites, a slow LCP comes down to an oversized hero image, slow hosting, or a page that has to download a lot of scripts before it can draw anything.
INP: does the page respond when I tap? INP looks at the delay between an interaction, such as tapping a menu, adding to cart or opening an accordion, and the next time the screen visibly updates. It considers interactions across the whole visit, not just the first one. Over 200 milliseconds needs improvement, and over 500 milliseconds is poor. INP replaced an older metric, First Input Delay (FID), in March 2024, so older reports and plugins may still mention FID. The usual cause of poor INP is too much JavaScript: chat widgets, tracking tags, sliders and page builder scripts all competing for the phone’s processor.
CLS: does the page stay still? CLS scores how much visible content moves unexpectedly. You’ve seen it: you go to tap a link, an ad or cookie banner loads above it, and you tap the wrong thing. The score has no units. 0.1 or less is good, and over 0.25 is poor. Common causes are images without set dimensions, late-loading fonts, and banners or embeds that push content down after the page has appeared.
Field data versus lab data: which numbers count?
This is where most confusion comes from. There are two kinds of measurement, and they often disagree.
Field data comes from real Chrome users visiting your site, collected in the Chrome User Experience Report. It reflects actual phones, actual networks and actual behaviour, summarised over the previous 28 days. Google assesses each metric at the 75th percentile, meaning the experience of most visitors, not the best case. Field data is what Google uses when it considers page experience.
Lab data comes from a single simulated test, such as Lighthouse, run on a set device and connection. It’s repeatable and useful for diagnosing problems, but it’s one synthetic visit. Lab tests can’t measure INP directly, because nobody is tapping anything, so they show a related metric called Total Blocking Time instead.
A low Lighthouse “performance score” and failing Core Web Vitals are not the same thing. The score is a lab summary. If your field data passes, real visitors are having a good experience even if the lab number looks worse than you’d like.
Where can I find my Core Web Vitals?
- PageSpeed Insights. Enter a URL at pagespeed.web.dev. The top section, if shown, is field data from real users. The section below is a lab test. Check the mobile tab first, since phones on mobile networks are usually the harder test.
- Google Search Console. The Core Web Vitals report groups your URLs into good, needs improvement and poor, for mobile and desktop separately, using field data. It’s the best overview of a whole site.
- No field data? Smaller sites often don’t get enough Chrome traffic for a page-level or even site-level result. In that case, lean on lab tests and test on a real mid-range phone yourself.
When you check, look at templates rather than individual pages. If one product page is slow, every product page probably is, because they share the same code. Fixing a template fixes them all. On an online store, the product, collection and checkout templates are the ones to check first.
How much do Core Web Vitals affect Google rankings?
Less than many sales pitches suggest. Google has said Core Web Vitals form part of its page experience signals, but relevance and content quality matter far more. A slow page that answers the question well will usually outrank a fast page that doesn’t. Passing all three won’t lift you to the top on its own, and failing them won’t usually sink a page that’s otherwise strong.
The better reason to care is people. A page that takes ages to appear, ignores taps or shifts under someone’s thumb loses enquiries and sales, whatever Google thinks. Treat good Core Web Vitals as a sign the site is pleasant to use, not as a ranking trick. Our technical SEO work treats speed as one item on the list, alongside indexing, structure and content.
What usually fixes each metric?
For LCP:
- Resize and compress the hero image, and serve it in a modern format. Our guide to faster pages from smaller images covers AVIF, WebP and sizing.
- Don’t lazy-load the main image at the top of the page. It should load first, not last.
- Improve server response time with caching, a CDN, or better hosting if the current plan is underpowered.
- Cut render-blocking scripts and stylesheets that load before anything can be drawn.
For INP:
- Audit third-party scripts. Remove tags nobody uses, and delay chat widgets and similar tools until after the page loads or until someone needs them.
- On WordPress, check for plugins loading scripts on every page when they’re only used on one.
- Break up heavy JavaScript work so the browser can respond between tasks. This one needs a developer.
For CLS:
- Give every image and video set width and height attributes, or a fixed aspect ratio in CSS, so space is reserved before it loads.
- Reserve space for embeds, ads and banners rather than letting them push content down.
- Load web fonts in a way that avoids a large jump when they swap in.
Before you pay for a speed fix
Ask for the field data first, and for a clear statement of which metric is failing, on which templates, and why. A good performance job names the cause and the fix. Be wary of promises of a perfect 100 score or guaranteed ranking gains. And if a site redesign is coming soon anyway, it may be better to build the improvements into that than to tune a site that’s about to be replaced; our piece on whether to fix or rebuild can help you decide.
If you only do three things
Check your mobile field data in PageSpeed Insights and Search Console. Shrink and properly prioritise the main image on your key templates. Remove or delay third-party scripts you don’t need. On many small business sites, those three steps are where most of the improvement comes from.
If you’d like someone to find the cause and fix it for a fixed price, that’s our website performance work. From $500. Most performance jobs land between $500 and $2,500.